Development metrics are everywhere—PR counts, story points, cycle time, deployment frequency, defect rates, and dozens more. There is no universal scorecard that fits every team. Mature organizations choose a small set aligned to how they ship (trunk-based deploys vs quarterly releases), what tools they use (GitHub only vs GitHub + Jira), and what question they need answered this quarter.
Metrics should fuel conversation and improvement, not ranking engineers or squads. If a number cannot change a retro, a planning decision, or a process tweak, it is probably vanity.
A quick taxonomy
| Family | Examples | Good for |
|---|---|---|
| Activity / throughput | PRs merged, commits, story points closed | Volume trends, capacity signals |
| Flow | Lead time, cycle time, queue time, created vs closed | Where work waits vs where it is actively worked |
| Code change size | Changed lines per PR or week | Spot outliers; weak alone as "productivity" |
| Quality / defects | Defect containment, production bugs opened | Escape to production, test effectiveness |
| Delivery / reliability (DORA) | Deploy frequency, lead time for changes, change failure rate, MTTR | Outcomes of the delivery system as a whole |
Teams at different stages emphasize different families. A startup on trunk deploys may care about deploy frequency and PR cycle time. A product org with long Jira backlogs may care about queue time and defect containment before anything else.
What I collect — GitHub
I aggregate Git-native signals from selected repositories into an Engineering Analytics view. Data comes from GitHub GraphQL—summary cards for the selected range plus weekly trend charts.
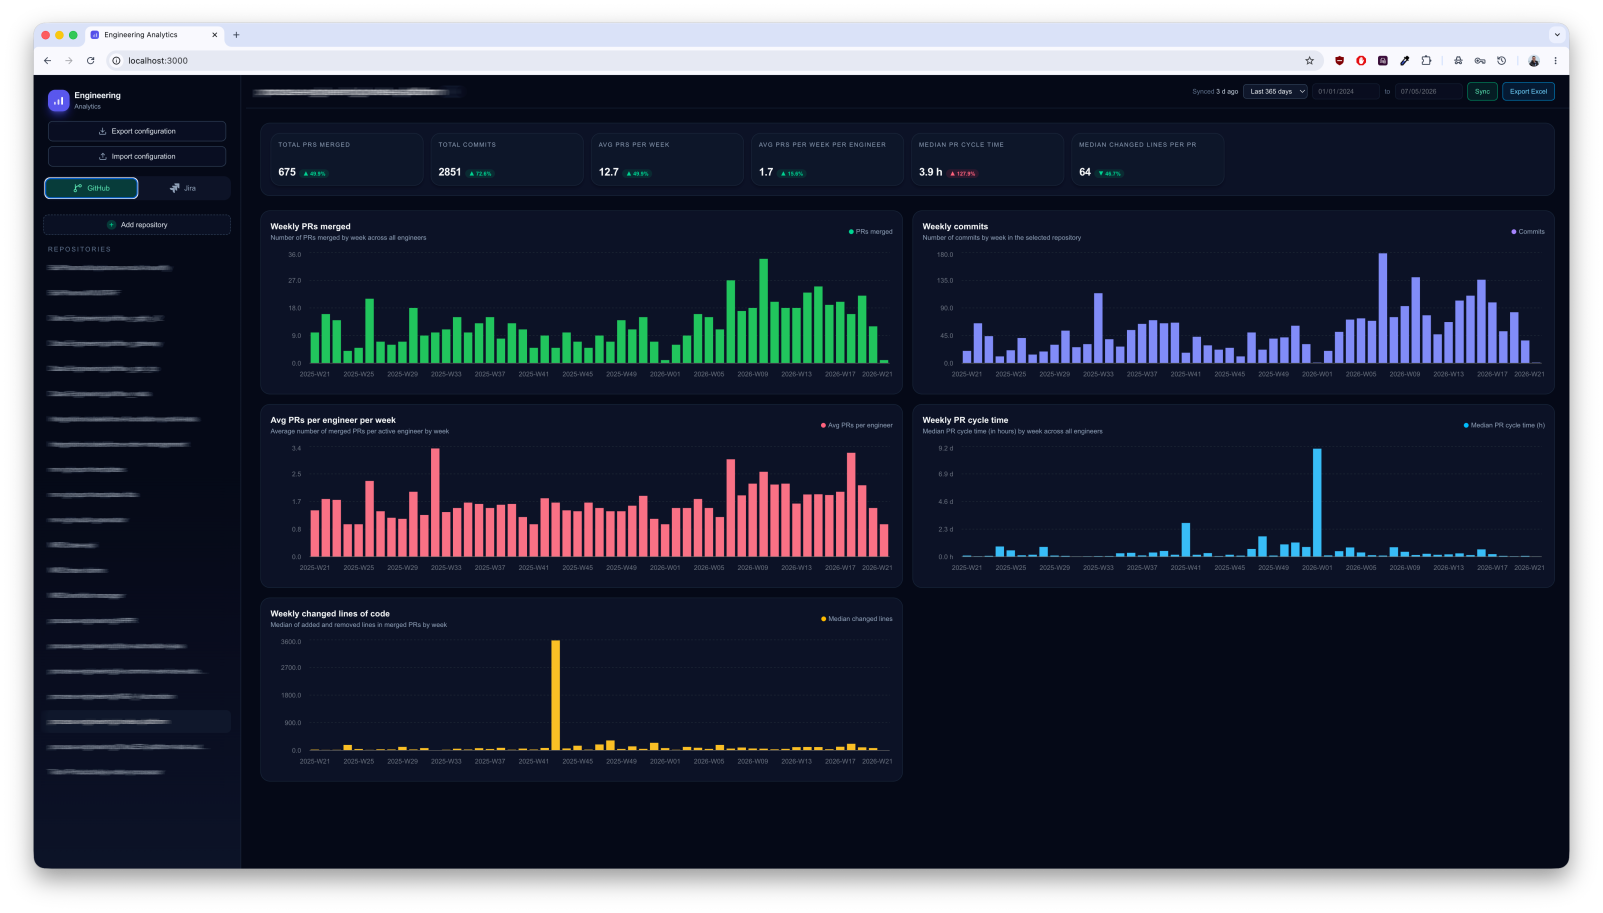
Summary cards
| Metric | What it means |
|---|---|
| Total PRs merged | Volume of integrated work over the date range |
| Total commits | Activity in connected repos (includes work outside PRs) |
| Avg PRs per engineer | Throughput normalized by contributor count—watch when team size changes |
| Avg PRs per engineer per week | Weekly view of the same signal |
| Median PR cycle time | Time from PR open to merge (review, CI, approvals, merge) |
| Weekly changed lines of code | Median lines added + removed per merged PR in a week—outliers stand out |
Weekly charts
- Weekly PRs merged — integrated work per week
- Weekly commits — commit volume over time
- Avg PRs per engineer per week — per-person throughput trend
- Weekly PR cycle time — median merge latency per week
- Weekly changed lines of code — median change size per week
These metrics are cheap to collect once repos are connected and answer: Is review/merge getting slower? Are we merging more or less? Did one week ship unusually large diffs?
Important nuance: median PR cycle time is related to DORA lead time for changes, but it is not the same unless every merge goes straight to production. A long release train, feature flags, or batch deploys mean merge-to-prod adds days or weeks on top of PR time.
What I collect — Jira
The same dashboard pulls Jira work items—Stories, Tasks, and Bugs—with flow and quality views. This answers product delivery and defect escape, not lines of code.
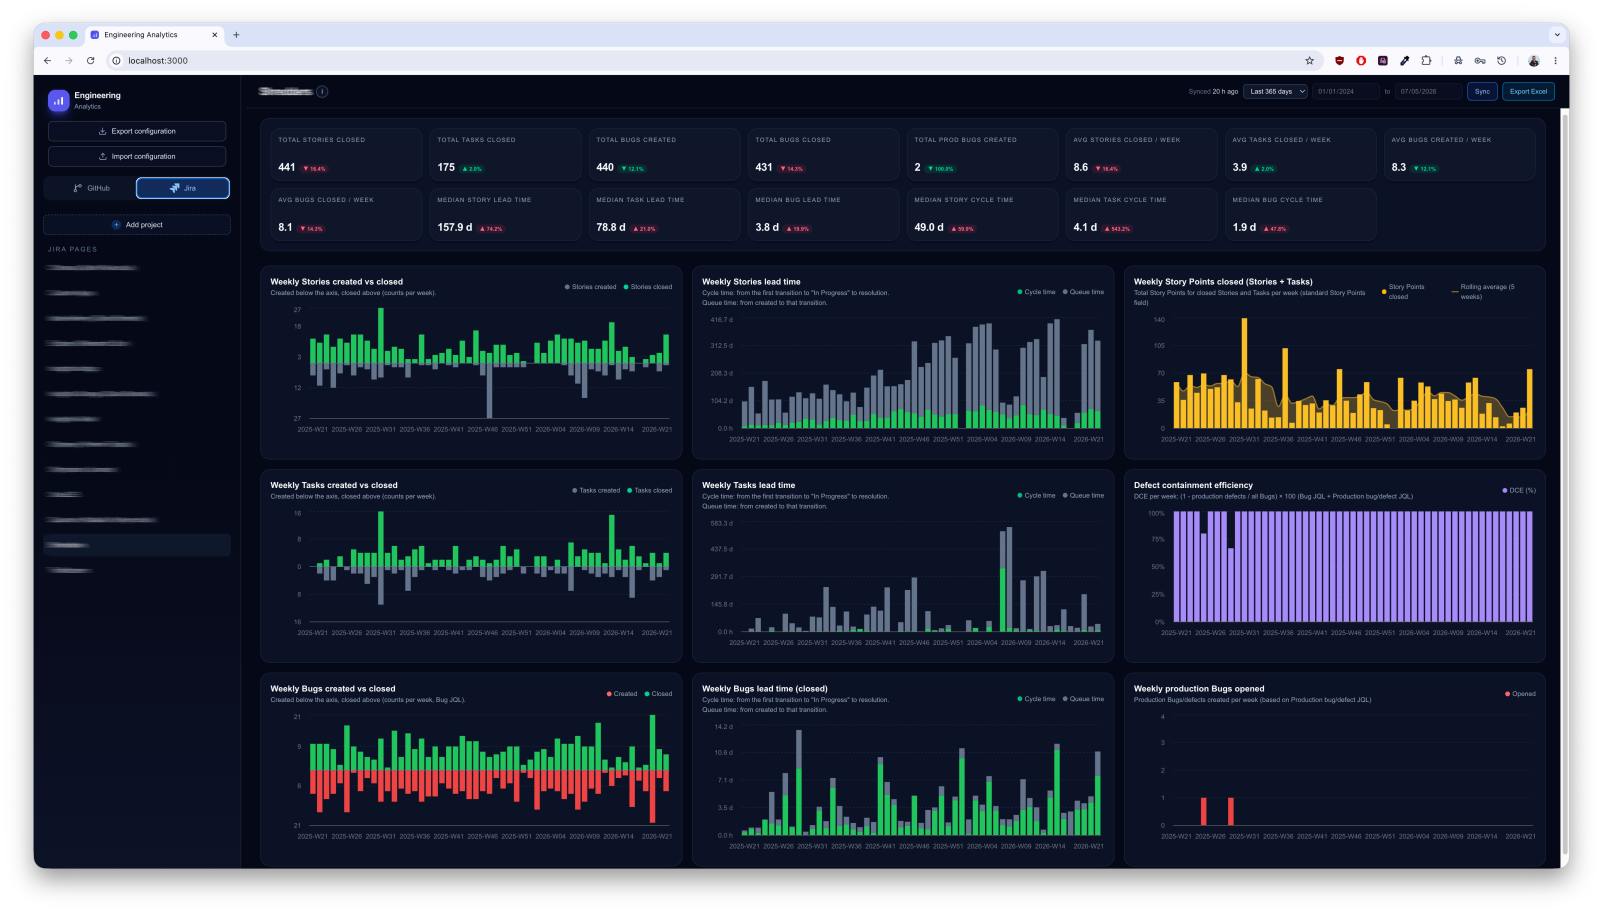
Stories
- Weekly Stories created vs closed — throughput balance (work entering vs leaving the system)
- Weekly Stories lead time — cycle time (active work) vs queue time (waiting in backlog or blocked states)
- Weekly Story Points closed (Stories + Tasks) — completed effort with a rolling average for velocity-style trends
Tasks
- Weekly Tasks created vs closed
- Weekly Tasks lead time — cycle vs queue split for tasks
Quality
- Defect containment efficiency — share of defects caught before production (pre-release quality)
- Weekly production Bugs opened — defects that escaped to production
Bugs
- Weekly Bugs created vs closed
- Weekly Bugs lead time (closed) — cycle vs queue for resolved bugs
The highest-value insight in retros is often cycle vs queue: when lead time is high, the team is frequently waiting (dependencies, unclear scope, review bottlenecks), not slow at typing. Production bugs opened and defect containment bridge toward change failure thinking even without a deployment API.
DORA — four outcome metrics
DORA (DevOps Research and Assessment) names four outcome metrics for software delivery performance. They describe how well the system delivers and recovers—not how busy individual developers look on a chart.
| DORA metric | Definition | Elite vs low (industry benchmarks) |
|---|---|---|
| Deployment frequency | How often the organization deploys to production | Elite: on-demand, multiple per day; low: monthly or less |
| Lead time for changes | Time from commit (or work accepted) to running in production | Elite: less than one day; low: weeks to months |
| Change failure rate | Share of deployments that cause production failure, rollback, or hotfix | Elite: 0–15%; low: roughly 46–60% in classic survey bands |
| Time to restore service (MTTR) | Time to recover when production is impaired | Elite: under one hour; low: a week or more |
DORA metrics are correlated: teams that deploy often tend to invest in smaller batches, faster feedback, and safer recovery—so lead time drops and failure impact shrinks.
How my dashboards map to DORA
| Metric I track | DORA relationship |
|---|---|
| Median PR cycle time | Partial lead time — merge stage only |
| PRs merged / stories closed | Proxy for throughput, not deploy frequency unless close ≈ release |
| Production bugs opened | Signal for change failure / quality escape |
| Defect containment efficiency | Quality metric; supports lower change failure rate; not a DORA metric itself |
| Bug lead time (closed) | Related to MTTR when bugs represent incidents |
Gap to be explicit: benchmark-grade DORA usually needs deployment and incident telemetry—CI/CD deploy events, rollbacks, PagerDuty or equivalent, error budgets. My Team Metrics stack is strong on GitHub + Jira flow today; wiring deploy and restore signals is the next step if you want full four-metric DORA scoring against industry tiers.
How to pick metrics for your team
- Start with one question — e.g. "Why do stories sit for two weeks before anyone picks them up?" → queue time and created vs closed. "Are we shipping broken changes?" → production bugs and change failure proxies.
- Pick one flow + one quality + one outcome for the quarter—not fifteen charts nobody opens.
- Avoid gaming — optimizing PR count or lines of code in isolation encourages the wrong behavior and meaningless cross-team comparisons.
- Review trends, not single weeks — one spike in cycle time or LOC is an outlier; four weeks is a conversation.
- Pair metrics with process — metrics show where to look; Definition of Done, BDD acceptance criteria, and technical debt control explain what to change.
Flow metrics also surface technical debt interest—when the same subsystem stays slow or defect-prone sprint after sprint, the chart backs a paydown conversation with product.
Team Metrics product
I built Team Metrics as an internal dashboard: GitHub analytics (merged PRs, commits, cycle time, changed lines) and Jira analytics (Stories, Tasks, Bugs, lead/cycle/queue time, story points, defect containment, production bugs). Configurable date ranges, repository and board selection, and Excel export support stakeholder reviews without manual spreadsheet wrangling.
It aggregates signals from tooling teams already use rather than asking leads to maintain parallel trackers.
Summary
- There are many development metrics; every team chooses a subset for their context.
- I track GitHub activity and PR flow plus Jira throughput, lead/cycle/queue time, story points, and quality escape.
- DORA defines four outcome metrics for delivery performance; my dashboards overlap (especially lead time and failure signals) but do not replace deploy and incident data for full DORA benchmarking.
- Use metrics for improvement, not leaderboards—and connect numbers to retros and process changes.
Related reading
- Agile, Scrum, and Kanban — when to use what — flow metrics, WIP, and lead time in Kanban
- What is technical debt? — flow metrics as debt "interest" you can chart
- What is behavior-driven development (BDD)? — quality and acceptance criteria before merge